Insights
2017 Second Quarter Review
Market returns were positive during the first half of the year. Emerging and international stocks led the charge, but almost all asset classes posted positive performance. Emerging market equities rose 18.4% through the first half of the year and international developed stocks were up 13.8%, while the S&P 500 was up “only” 9.3%. A relatively strong global economy has provided a supportive backdrop for stocks. Corporate earnings rose, driving equity returns despite relatively high stock valuation levels. In addition, the Federal Reserve signaled in March that it would be restrained in raising rates, and the election of President Macron in France reduced concerns about rising anti-Euro sentiment. In the U.S., there has been no major surge in trade protectionism nor has there been any large fiscal stimulus such as a tax cut or infrastructure spending.
Global Index Performance for 2017
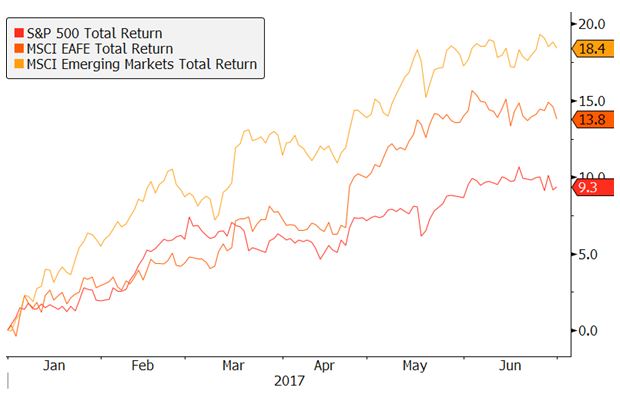
Source: Bloomberg
United States bond prices have increased as yields fell. When President Trump was elected, investors expecting large tax cuts and a big infrastructure bill sold bonds, leading to an increase in yields. This year, as the prospects for an infrastructure bill have faded and the timing of a tax cut has been deferred, bond yields have fallen. It is hard to see how stocks and bonds continue to march higher in tandem. Continued declines in yields would point to an economic slowdown, which would not be good for stocks. Alternatively, a pickup in economic growth, perhaps spurred by tax cuts, would lead to higher interest rates and lower bond returns.
One of the few major asset classes that declined during the first half of 2017 was commodities. Despite attempts by OPEC and Russia to curtail supply, and despite a positive global economic backdrop, oil prices have declined year to date.
West Texas Intermediate Crude Oil Spot Price for 2017
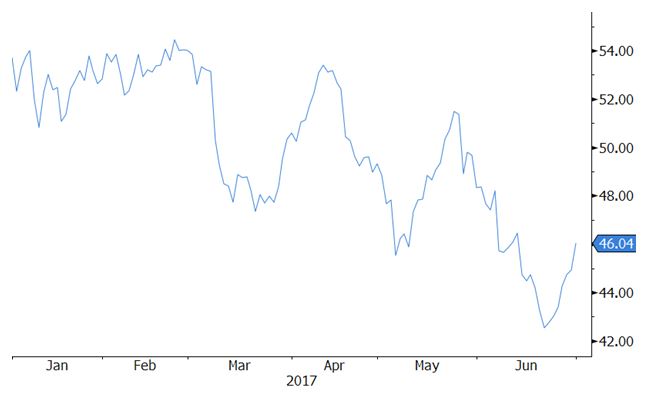
Source: Bloomberg
Oil traders have been expecting market supply and demand to clear since late 2015, but there is still excess oil inventory. OPEC and Russia have attempted to curtail supply, but the rapid recovery in U.S. shale production has filled the gap. Shale oil companies have been able to reduce their break-even costs from $80 per barrel in 2014 to just below $40 per barrel today. This was achieved both through greater cost efficiencies as well as drilling innovations. Shale producers can rapidly increase or decrease production. They thus serve as the marginal source of supply and in effect set the price for the industry as a whole.
More importantly, demand for oil is reaching an inflection point. China’s economy is becoming less oil intensive, with diesel demand down 0.4% in the first quarter of 2017 amid a shift to services and consumption. China’s crude oil demand has been elevated due to stockpiling but oil products demand was only up 0.9% in 2016, well below the trend of the past decade. In fact, the ratio of oil product consumption to GDP growth was 0.14 in 2016 – much below the 0.62 average for the past 16 years. Of even greater consequence is the adoption of alternative fuel sources for both power generation and increasingly in transportation. The chart below shows the levelized cost of electricity (or LCOE) (a proxy for the average price a generating asset must receive to break even). Wind power is already more economic than coal or gas, and solar is increasingly competitive even without subsidies.
Projected Levelized Cost of Electricity of Renewables Versus New Fossil Plants
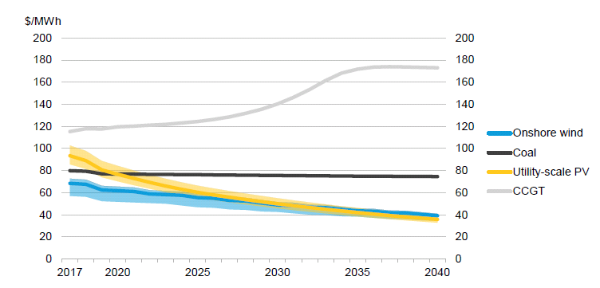
Source: Bloomberg New Energy Finance. CCGT stands for combined cycle gas turbine.
Markets anticipate the future by reacting to incremental change in key indicators to identify opportunities. In energy, share of growth is more important than installed capacity. Fossil fuels will play an important role for many years to come, but stock prices will have declined long before the last coal plant closes. Coal equity prices have already plummeted, even though coal is still the largest single source of electricity supply in the U.S. However, coal’s share as a source of power is in decline compared to other alternatives.
Annual Share of Total U.S. Electricity Generation by Source 1950-2016
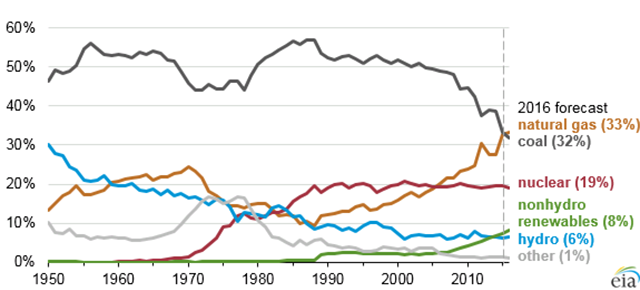
Source: Energy Information Administration
This marginal change in demand has had a large impact on stock prices. Investors in the Dow Jones U.S. Coal Index would have lost 75% over the last five years versus a positive 99% return for the S&P 500.
Total Return of Dow Jones U.S. Coal Index versus S&P 500 since 2012
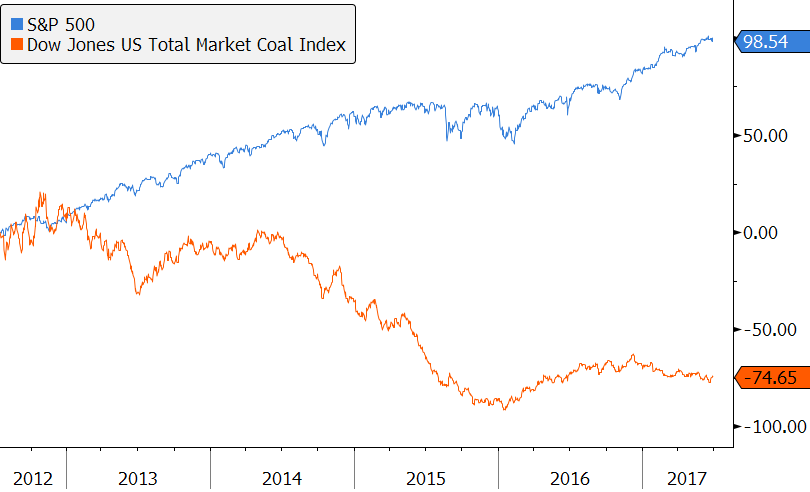
Source: Bloomberg
Oil and gas companies currently comprise 15% of the total market capitalization of the global stock market. The question for investors is not when will alternatives become the leading source global energy supply but rather when will incremental energy demand be met solely by alternatives? In a 2017 paper to the Smith School of Enterprise and the Environment, author Kingsmill Bond estimates the date for when new energy is met solely through alternatives will be 2020. This is based on current growth rates of 20% in wind and solar generation, with total global energy demand growth of 1% per year, as forecasted by the International Energy Agency. Goldman Sachs forecasts that sales of pure combustion engine cars will peak in 2020 and that wind and solar will gain 1% of annual energy supply market share every year. In addition, Goldman Sachs forecasts that lighting consumption, which is estimated to be around 8.5% of total electricity demand in the United States, could decline by 62% by 2025 as LED lights supplant incandescent lights. The confluence of increased efficiency, technology displacement and alternate sources of power generation will cap growth for traditional energy companies soon. Once it is evident that demand for a commodity is in decline, prices will adjust downwards and stock prices for oil companies will decline as well.
The primary future for energy demand will be the emerging markets, specifically China and India. Both countries have strategic reasons to encourage alternative energies. Oil imports account for half of India’s trade deficit. Both countries are already battling dangerous levels of urban pollution that, left unchecked, threatens political stability. In response to pollution concerns, China cancelled plans to build an additional 100 coal fired power plants. China is also planning for five million electric vehicles by 2020. In addition, China is already the dominant global producer of lithium-ion batteries which are key for energy storage and electric vehicles. According to Bloomberg New Energy Finance, China is intent on dominating this market, and global capacity is set to double by 2021, spurring innovation and lowering prices.
India is expected to account for more than half of the increase in oil demand over the next 25 years. With energy usage per person still at only 7% of U.S. levels, India is the first country that has the option to move directly to renewables, given the strong strategic rationales as well as the increasing attractive economic reasons for pursuing a jump straight to alternatives.
To assess the current economic situation, we focus on the marginal rate of change of key factors. The U.S. economy is doing reasonably well, but stock market valuations are high. Operating margins for companies peaked in 2014, and are set to decline further as wage growth increases but productivity remains low. Declining margins mean sales growth must increase for earnings growth to remain constant. Valuation multiples are unlikely to rise and could contract if interest rates rise. Though they do not necessarily signal an imminent market pullback, the marginal trends in these factors point to more muted equity performance going forward. We therefore continue to focus on targeted opportunities such as water, healthcare, and emerging Asia where growth prospects remain higher. In fixed income, we remain wary of the current low yield environment as we think bond yields will rise, especially if a tax cut is enacted this year. We favor higher yielding opportunities that assume credit risk in lieu of interest rate risk. The first six months of the year have been a “goldilocks” outcome for investors as both stocks and bonds have enjoyed positive returns. As such, this is a great time to take stock of any changes in personal circumstances and ensure that your portfolio’s risk level remains appropriate.
Printable version.
Disclosures:
This presentation is for informational purposes and does not constitute investment advice, nor should it be considered a recommendation to purchase or sell any particular security. The opinions expressed are those of the Choate Investment Advisers (“ChoateIA”). Firm holdings for the last 12 months are available upon request. Investing involves the risk of loss of principal. Additional information about the risks can be found in Form ADV Part 2, which is available upon request.
ChoateIA is a registered investment adviser. Registration does not imply a certain level of skill or training. More information about the firm can be found in its Form ADV Part 2, which is available upon request by emailing info@choateinvestmentadvisors.com.