Insights
2021 Third Quarter Review
While the global stock market is up 11% so far this year due to strong corporate earnings growth, stocks finished the third quarter down 1% as September declines reversed the gains from the first two months of the quarter. The Barclays Aggregate Bond Index is down -1.5% so far this year due to increasing interest rates pulling down bond prices, with a flat return over the third quarter.
We have generally been adding to stocks over the past year, and most client portfolios began the third quarter overweight equities. As mentioned in prior newsletters, we preferred to add stocks more than bonds due to several factors:
1. Vaccine rollouts
2. Corporate earnings growth exceeding investor expectations
3. Federal fiscal spending stimulus
4. Monetary policy remaining accommodative
This confluence of events provided an unusual tailwind for investors. For example, this is the first year since 2009 that fiscal stimulus and accommodative monetary policy were both in sync. However, unlike 2009, household balance sheets are in very good shape. This can be seen by looking at US household net worth as a percentage of disposable income reaching a recent high point, which represents a 20% increase over the low in 2020.
US household net worth rose 20% since 2020 trough
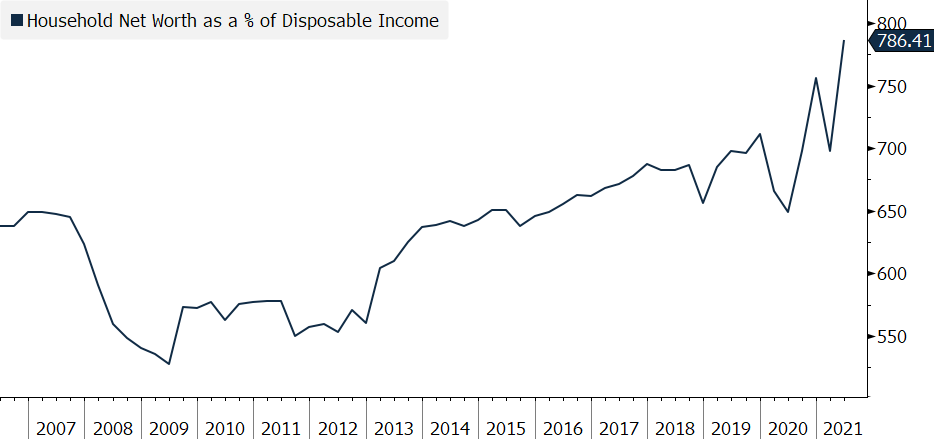
Source: Bloomberg. Latest data available as of 6/30/2021.
These four factors are still providing tailwinds for investors, and as we look forward, we remain optimistic. However, we question how the recovery will change over the next several months.
The initial vaccine rollout provided a catalyst for increased household demand, with spending well above initial expectations. As a result, corporate earnings consistently beat analyst earnings forecasts due to this higher demand. As we highlighted in our second quarter update, S&P 500 forecasted aggregate earnings for 2021 showed significant upward revisions from the 2020 trough through Q2 of 2021, and the chart below shows a 25% increase from the trough through July 2021. However, we now think analyst expectations have caught up to fundamentals, which may lead to a more “normal” period for investors compared to the first seven months of this year. As shown in the chart below, the forecasted earnings number has stopped increasing over the last two months. With expectations now matching fundamentals, we expect future market returns to be more in line with historical averages.
S&P 500 change in forecasted aggregate earnings for 2021 has recently slowed
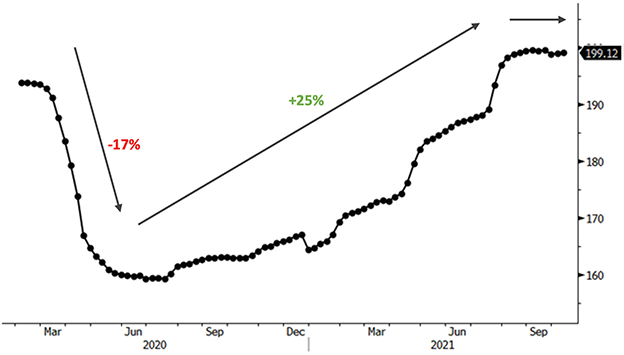
Source: Bloomberg. Data as of 9/30/2021.
Federal fiscal spending is another key factor to our thesis. There is consensus that the extraordinary fiscal support in the US will diminish going forward. However, the pace of fiscal tightening is unknown, and we’ve learned some lessons from the past. Looking back, the 2010-2011 pivot to austerity was a drag to the overall economy at a vulnerable point when the economy could ill afford it. In comparison, today’s corporations, households, and state and local governments are in much better shape, but a sharp reduction in the federal deficit could nonetheless derail economic growth.
Finally, accommodative monetary policy has been a major tailwind to market returns. There is consensus that the Federal Reserve will start to taper its bond purchases this fall. This is an expected first step before raising interest rates at some point in the future. However, two key aspects are still unknown: when will the Federal Reserve ultimately raise interest rates, and what will be the pace of the interest rate increases? The chart below depicts the trend in market expectations for 3-month Treasury rates (in effect the rate set by the Federal Reserve) for 2024. From the chart, it is clear that investors remain uncertain on where rates will be in 2024 since expectations increased dramatically from 0.80% to 2.0% in the first three months of the year, and have since tapered off and fluctuated between 1.2% and 1.6%. It’s important to also keep in mind that despite recent inflationary pressures, investor expectations for short-term rates are fairly low, and remain well below the 2.4% we saw in late 2018.
Market expectations for future short term Treasury rates in 2024 remain uncertain
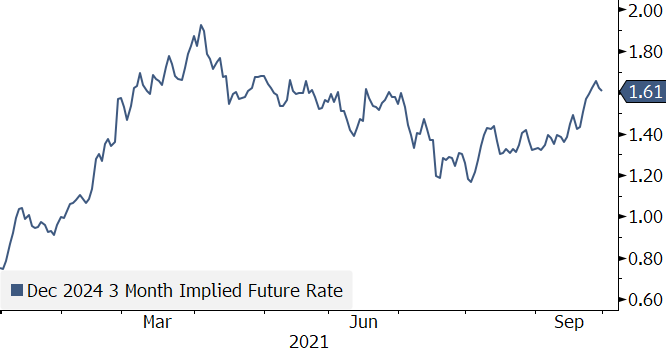
Source: Bloomberg. Data as of 9/30/2021.
We know that future action by the Federal Reserve is very much dependent on the future path of inflation. Will inflation prove to be “transitory” as the Federal Reserve expects, or will the supply chain and labor market disruptions continue and create more persistent inflation? We shared the below consumer price heat map in our second quarter letter, and now we have updated the table to show data through August. Inflation in categories such as vehicles & parts, energy, and transportation services remain elevated overall, but has come down from May levels.
Year-over-year inflation highlights inflation levels may have crested
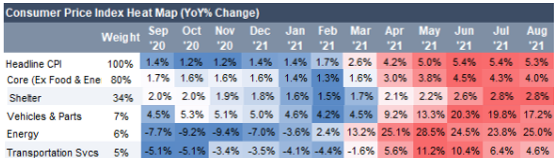
Source: Creditsights, BLS. Latest data available as of 8/31/2021.
This measure of inflation tracks the year over year change in price compared to the price level in the prior year period. For example, oil prices have moved year on year from $40 per barrel to almost $80 per barrel. For oil prices to impact inflation in a similar fashion going forward, oil prices would have to rise next year to $160 per barrel, a price we have never seen before. Therefore, as we look forward, we expect the rise in energy, vehicle prices and transportation to moderate, and shelter will likely become the primary driver of inflation.
Supply chain bottlenecks have spread beyond semiconductors and vehicles to other parts of the economy, and it is hard to tell when these will be resolved. Below are a few key points we think are worth monitoring.
- With the holiday season approaching, consumers may have difficulty getting packages delivered in time for the holiday season.
- As of September 27th, there were more than 60 ships waiting to unload off the busiest ports in Southern California. Unlike their international peers, Los Angeles and Long Beach ports have only just started now operating 24 hours a day and seven days a week, so there has been time lost unloading, and there is an opportunity to increase throughput. However, at the same time there is a shortage of storage on land and truckers to transport the goods.
- The Federal Reserve index on delivery time, which tracks when survey respondents see delivery times as a problem, has spiked and is well above the long-term average.
- Shipping costs have risen dramatically. The Shanghai Shipping Container Index, which measures the change in shipping goods from China to various ports, has increased 350% in 2021.
- Semiconductor chip shortages have rippled through the economy and specifically affected vehicle production, which has led to severe inventory de-stocking in the auto sector. The lack of inventory is also acute in the clothing sector, and the latest ISM manufacturing survey had 45% of respondents saying inventory is too low, twice the level reported pre-pandemic.
Until these and other supply chain disruptions are resolved, it will be difficult for investors to predict the path of inflation for manufactured goods. At the same time, predicting inflation on the services side is equally difficult, as the labor market has still not returned to “normal”. In fact, a number of statistics point to a jobs market that is behaving erratically:
- The August unemployment rate was 5.2% with roughly 3 million more people unemployed versus February 2020. Long-term unemployment (greater than 6 months) accounts for 39% of total unemployment.
- Despite high unemployment, there was a record number of job openings at 10. 1 million at the end of June.
- The quit rate, usually an indication of a strong job market, is very high and above pre-pandemic levels despite significantly higher unemployment.
- Labor force participation remains well below pre-pandemic levels.
- Hiring volume is slow and employers are becoming creative to attract talent. There is an increased use of signing bonuses, on-the-job training, childcare support, and other opportunities.
Employees are increasingly comfortable quitting in search of other job opportunities
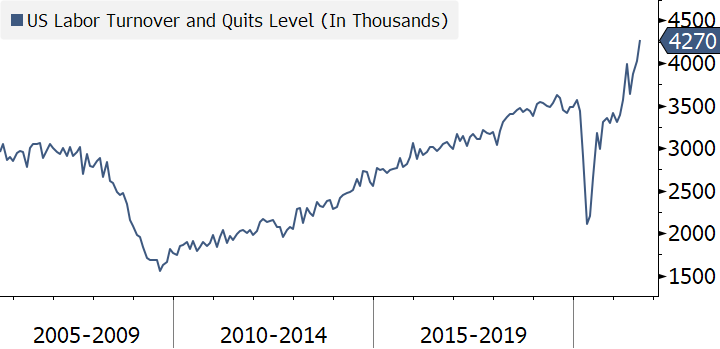
Source: Bloomberg. Latest data available as of 8/31/2021.
Labor force participation still remains well below pre-pandemic averages
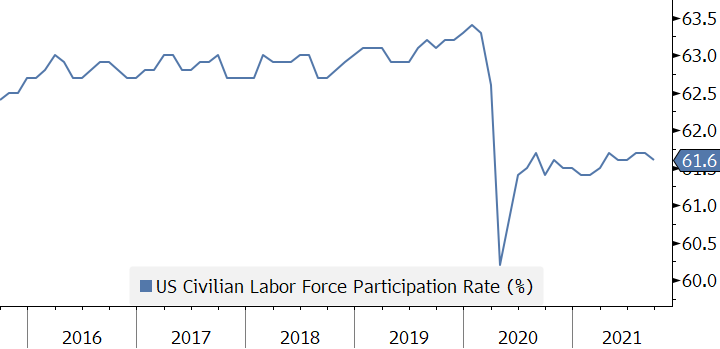
Source: Bloomberg. Data as of 9/30/2021.
This competition for labor has not led to extraordinary wage gains yet. Wage growth has surged from low of 3.0% earlier this year to 4.2%, but remains in line with recent historical norms. Elevated wage growth is a key ingredient for sustainable inflation. Absent wage growth, price increases will quickly lead to lower demand as buyers step back from higher prices.
Average wage growth in line with historical average
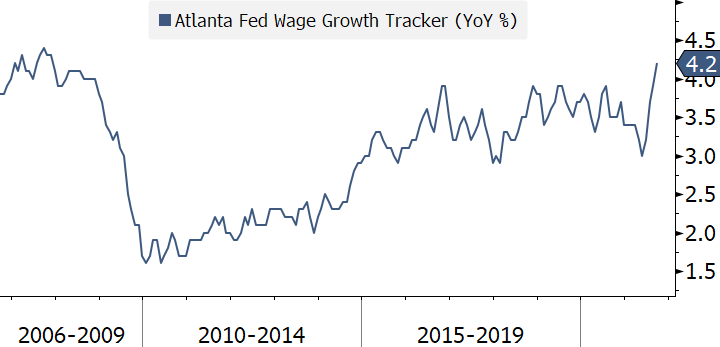
Source: Bloomberg. Data as of 9/30/2021.
In summary, we believe the economy is returning to a more “normal” environment for investment returns, but it is still uncertain what that means. We do not yet know how much this new normal will be different from the pre-pandemic era. Will there be faster inflation that forces the Federal Reserve to increase interest rates to levels not seen since the global financial crisis? Will supply chains and labor markets remain in flux? If inflation proves transitory (as the Federal Reserve forecasts), then will this new normal end up being much like the pre- pandemic normal?
At present, we still foresee tailwinds for stocks despite economic growth finally decelerating. We continue to view stocks as attractive investments with higher return prospects, especially since the alternatives, in the fixed income markets, are expensive.