Insights
2018 Third Quarter Review
The third quarter of 2018 brought continued strength in the U.S. stock market. International stocks, particularly emerging markets, lagged due to dollar strength and monetary tightening by the Federal Reserve, fear of impact from the trade conflict, and concern about China’s economy. Global markets appreciated 4.3% in the quarter, led by the U.S. markets which gained 7.7%. Emerging markets declined 1.1%.
We believe U.S. stocks are likely to face increasing headwinds going forward. In our last quarterly update, we focused on long-term challenges posed by market fundamentals:
- Stretched valuations: Elevated valuation multiples reflect bullish investor expectations. This leaves stocks vulnerable to disappointment if future corporate earnings are lower than expectations. Continued strong earnings reports are required to support current valuation levels. In addition, rising corporate leverage increases the vulnerability of stocks to an economic slowdown.
- Earnings headwinds: The earnings boost from the 2018 tax cut will fade in 2019, leading to lower earnings growth next year. In addition, the burgeoning trade conflict between the U.S. and China seems increasingly likely to depress earnings growth. A stronger U.S. dollar will also reduce overseas earnings for multinational firms.
- Policy actions: Continued interest rate hikes from the Federal Reserve will at some point begin to slow down economic growth. At the same time, the benefits from the recent tax cuts and spending bill will dissipate. Investors may become increasingly concerned about the implications of the rapidly expanding U.S. budget deficit.
In addition to considering these fundamental challenges, investors should also pay attention to “technical” market factors stemming from how the markets operate. Factors such as market breadth, sentiment and concentration of returns can shed light on investor motivation and positioning and are often an indicator of future market dynamics.
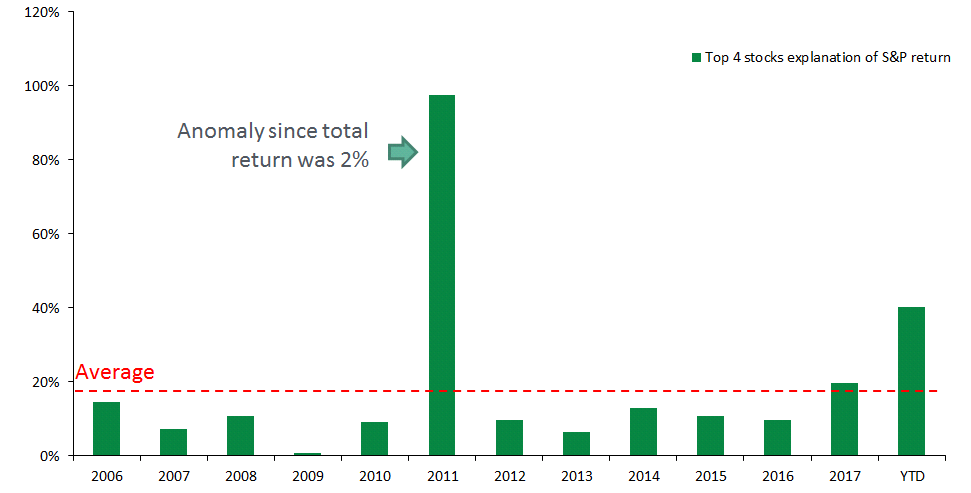
So far, stock market returns in 2018 are being propelled by a few very large technology firms. Just four companies created 40% of the gains in the S&P 500 so far this year. Typically, such narrow gains are a sign of market fragility as performance of the broad stock market provides a better signal of evolving economic conditions. Additionally, because all these market-moving firms are the same industry, the possibility for an event impacting all four firms is high.
A few companies are driving market returns

Source: Bloomberg, year to date as of 9/30/18
This concentration of returns in a few companies is the highest since 2011. In 2011, the top four firms were in disparate industries, and the U.S. stock market ended up returning only 2% for the year.
S&P 500 returns are typically more diversified
Source: Bloomberg, year to date as of 9/30/2018
Not only are just a few companies driving U.S. stock market returns, but most sectors are actually struggling. This year, S&P 500 returns are overwhelmingly being driven by technology companies.
Return by sector year to date

Source: Bloomberg, year to date as of 9/30/18
Another way to understand the breadth of market returns is to compare the returns of the S&P 500 index, which is market capitalization weighted, to an equally weighted index of the S&P 500, where each stock contributes equally to returns.
Equal weight S&P versus traditional market cap weight S&P 500 index

Source: Bloomberg
The market capitalization weighted index significantly outperformed an equally weighted index of the same stocks, meaning that S&P 500 returns since March were propelled by the largest companies. So far in 2018, there has been a great deal of “momentum” in the U.S. stock market, with money flowing into the largest companies. It is always tempting to chase momentum, but we feel it is better to be cautious. History shows that momentum will ultimately reverse. Some well-respected momentum-based indicators such as the Goldman Sachs “bull/bear” indicator are signaling that the turning point could be relatively soon.
Goldman Sachs sentiment indicator

Source: Goldman Sachs
The Goldman Sachs indicator is based on a measure of equity valuation, growth momentum, unemployment, inflation, and the yield curve. It is at its highest level since 1969, and typically peaks just before a recession. When sentiment is very bullish, it is usually wise to focus on risk mitigation rather than to chase returns.
Consumer sentiment

Source: Bloomberg, 9/30/18
Consumer and business confidence is at highs not seen since 1999. Peaks in confidence typically coincide with stock market highs, and the extraordinarily high peak of 1999 was followed by three successive years of market decline.
As an investor, it is important to assess what other investors are forecasting. If other investors are generally pessimistic, then stocks may be a good buy even if conditions deteriorate further. However, when consumer and business sentiment are near all-time highs and investor sentiment is also very bullish, markets are likely to be highly sensitive to even “less good” news. At present, it seems that many investors are taking a page from Chuck Prince, the former CEO of Citigroup, who said in 2007 “When the music stops, in terms of liquidity, things will be complicated. But as long as the music is playing, you’ve got to get up and dance. We’re still dancing.”
We are concerned that the economy may enter a recession and the stock markets may endure a material correction in 2019 or 2020. Substantial market corrections occur regularly and can be quite severe. On average, it has taken the stock market over four years to fully recover from the price decline.
Prior market downturns

Source: Bloomberg
Given these market dynamics, we continue to reduce risk in a measured fashion across our client portfolios. We also advise investors to reflect upon their current situation and long-term goals. We believe the most certain way of limiting downside risk is to be appropriately conservative, recognizing that dramatic attempts to time the market usually leave one worse off. For example, a balanced portfolio of bonds and stocks would experience about half of the average stock decline of 36% calculated from prior declines. Given the possible scale of decline and the time for recovery, now is a good time to ensure that the investment strategy that underpins your portfolio continues to be appropriate for your long-term goals.
Printable version.
Disclosures:
This report is prepared by Choate Investment Advisors LLC (“ChoateIA”), a subsidiary of Choate, Hall & Stewart LLP. ChoateIA is registered as an investment advisor with the Securities and Exchange Commission. Registration does not imply a certain level of skill or training. More information about the firm can be found in its Form ADV Part 2, which is available upon request by emailing info@choateinvestmentadvisors.com.
This presentation is for informational purposes and does not constitute investment advice. None of the information contained in this report constitutes, or is intended to constitute, a recommendation of any particular security, trading strategy or determination by ChoateIA that any security or trading strategy is suitable for any specific person. Investing involves the risk of loss of principal. To the extent any of the information contained herein may be deemed to be investment advice, such information is impersonal and not tailored to the investment needs of any specific person.
The opinions expressed are solely those of ChoateIA. The information contained in this report has been obtained and derived from publicly available sources believed to be reliable, but ChoateIA cannot guarantee the accuracy or completeness of the information. Past performance is no guarantee of future results.